
Fayl:OECD Social Expenditure by Braunch.svg

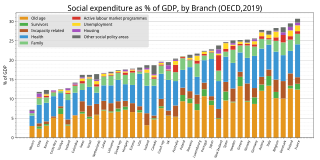
Size of this PNG preview of this SVG file: 800 × 400 piksel. Boshqa oʻlchamlari: 320 × 160 piksel | 640 × 320 piksel | 1 024 × 512 piksel | 1 280 × 640 piksel | 2 560 × 1 280 piksel | 1 260 × 630 piksel.
Asl fayl (SVG fayl, asl oʻlchamlari 1 260 × 630 piksel, fayl hajmi: 196 KB)

|
This file may be updated to reflect new information. If you wish to use a specific version of the file without it being overwritten, please upload the required version as a separate file. |
Qisqa izoh
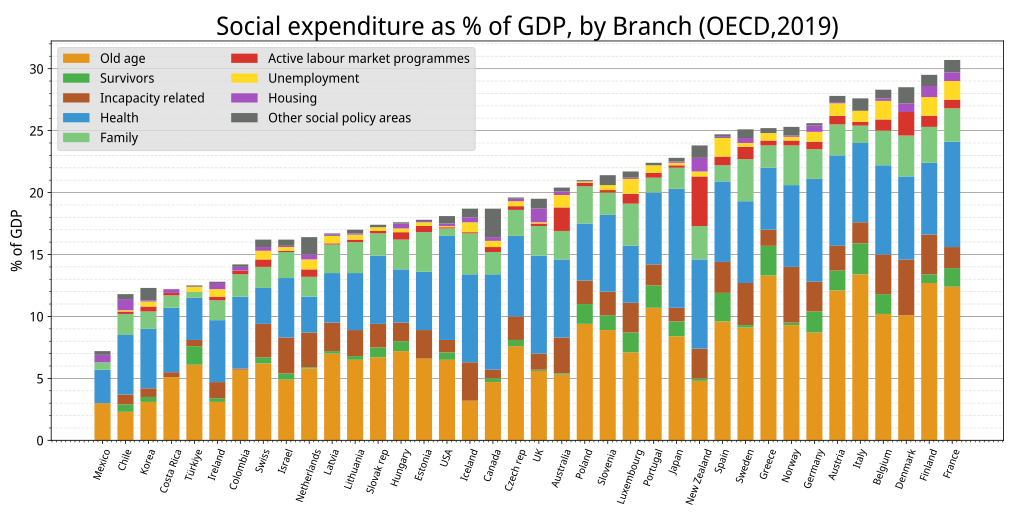
| Taʼrif | Social Expenditure as % of GDP by Braunch, (OECD 2019) |
| Sanasi | |
| Manba |
Oʻzimning ishim, Data from OECD SOCX https://stats.oecd.org/Index.aspx?DataSetCode=SOCX_AGG |
| Muallif | Yuasan |
| Ruxsat (Bu faylning takror foydalanilishi) |
CC-0 |
Litsenziyalash
I, the copyright holder of this work, hereby publish it under the following license:
| This file is made available under the Creative Commons CC0 1.0 Universal Public Domain Dedication. | |
| The person who associated a work with this deed has dedicated the work to the public domain by waiving all of their rights to the work worldwide under copyright law, including all related and neighboring rights, to the extent allowed by law. You can copy, modify, distribute and perform the work, even for commercial purposes, all without asking permission.
|
Graph data
import numpy as np
from cycler import cycler
import matplotlib.pyplot as plt
import pandas as pd

df = pd.read_csv("data.tsv", index_col=0 , sep = "\t")
df = df.sort_values(by=["Total"], ascending=True).fillna(0)
df1 = df.drop('Total', axis=1).T

#plt.rcParams["axes.prop_cycle"] = plt.cycler("color", plt.get_cmap("tab20")(np.linspace(0,1,12)))
plt.rcParams['axes.prop_cycle'] = cycler(color=['#e5961d', '#4DAF4A', '#B15928', '#3b95d3', '#7FC97F', '#d7352b', '#ffd924', '#a652c1', '#686d69'])

fig, ax = plt.subplots(figsize=(14, 7))
for i in range( len(df1) ):
	ax.bar(df1.columns, df1.iloc[i] , width=0.7, bottom=df1.iloc[:i].sum())

ax.legend(df.columns, fontsize=13,  loc='upper left', ncol=2,  frameon=True, facecolor="#dddddd")
ax.set_axisbelow(True)

plt.rcParams['font.family'] = 'sans-serif'
plt.rcParams['font.sans-serif'] = ['Noto Sans Display']
plt.subplots_adjust(left=0.05, bottom=0.14, right=0.98, top=0.92)

plt.title("Social expenditure as % of GDP, by Branch (OECD,2019)", fontsize=25)
plt.tick_params(labelsize=10, pad=4)

plt.xticks(df.index, rotation=70, size=10)
plt.yticks(fontsize=13)
plt.ylabel("% of GDP", size=15)

ax.minorticks_on()
plt.grid(which='major',color='#999999',linestyle='-', axis="y")
plt.grid(which='minor',color='#e3e3e3',linestyle='--', axis="y")

plt.savefig("image.svg")
Any autoconfirmed user can overwrite this file from the same source. Please ensure that overwrites comply with the guideline.
Fayl tarixi
Faylning biror paytdagi holatini koʻrish uchun tegishli sana/vaqtga bosingiz.
| Sana/Vaqt | Miniatura | Oʻlchamlari | Foydalanuvchi | Izoh | |
|---|---|---|---|---|---|
| joriy | 14:56, 2023-yil 24-fevral | | 1 260 × 630 (196 KB) | Yuasan | 2019 data |
| 09:53, 2021-yil 13-iyul |  | 1 440 × 720 (153 KB) | Yuasan | 2017 data | |
| 08:22, 2015-yil 30-noyabr |  | 735 × 416 (139 KB) | Yuasan | 2011 | |
| 01:41, 2014-yil 6-may |  | 746 × 438 (106 KB) | Yuasan | User created page with UploadWizard |
Fayllarga ishoratlar
Bu faylga quyidagi sahifa bogʻlangan:
Faylning global foydalanilishi
Ushbu fayl quyidagi vikilarda ishlatilyapti:
- en.wikipedia.org loyihasida foydalanilishi
- eo.wikipedia.org loyihasida foydalanilishi
- ja.wikipedia.org loyihasida foydalanilishi
- ko.wikipedia.org loyihasida foydalanilishi
- la.wikipedia.org loyihasida foydalanilishi
- th.wikipedia.org loyihasida foydalanilishi
- tr.wikipedia.org loyihasida foydalanilishi
- zh-yue.wikipedia.org loyihasida foydalanilishi